Total viable and total gram-negative count
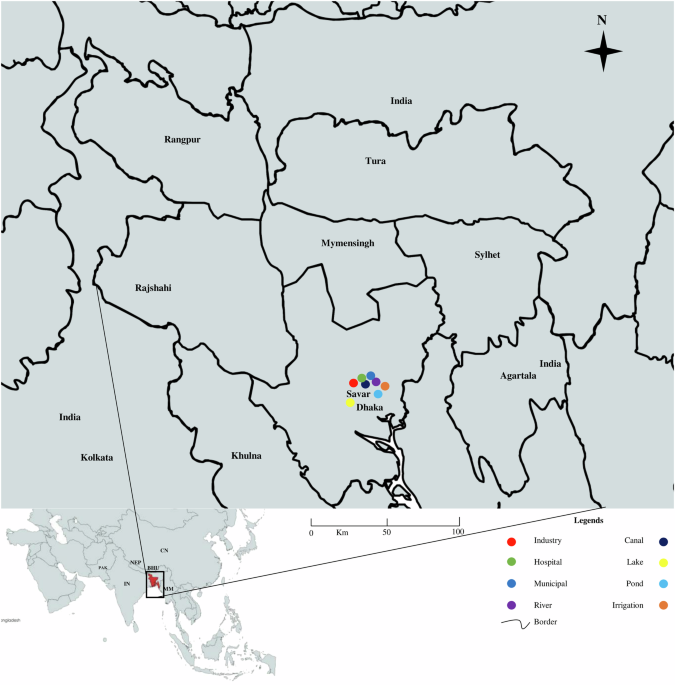
The total viable count on the nutrient agar plate ranged between 1.7 × 10³ cfu/ml and 2.1 × 10⁹ cfu/ml and the highest count was found in the sample of a canal located in Bank Town (2.1 × 10⁹ cfu/ml) and the lowest count was found from the sample of irrigation water in the Gerua area near Jahangirnagar University (1.7 × 10³ cfu/ml). Gram-negative bacterial count on the MacConkey agar plate ranged between 1 × 10² cfu/ml and 1.52 × 10⁶ cfu/ml and the highest count was found in the sample of a canal located in Bank Town (1.52 × 10⁶ cfu/ml) and the lowest count was found from the sample of irrigation water in the Gerua area near Jahangirnagar University (1 × 10² cfu/ml). Sampling regions were indicated on the map with legends focusing on different sources (Fig. 1).
Association of physicochemical parameters
Observations revealed significant fluctuation in the temperature of the water samples, ranging between 16.3 and 30.5 °C. The pH levels of these samples also varied significantly, ranging from pH 5.3–8.8 (Supplementary Table 1). The dissolved oxygen (DO) levels varied across different water samples. Industrial wastewaters exhibited the lowest DO concentrations, with values spanning from 1.5 to 4.5 mg/L. Hospital and municipal wastewaters displayed DO ranges of 2.0–4.8 mg/L and 2.6–5.0 mg/L, respectively. Industrial wastewaters were associated with the most elevated biological oxygen demand (BOD) values, which fluctuated from 200 to 450 mg/L. Hospital wastewaters and municipal wastewaters had BOD values in the ranges of 100–250 mg/L and 200–350 mg/L, respectively. Further, chemical oxygen demand (COD) varied from 25.05 mg/L to 442.31 mg/L among different sources.
We determined the association of the prevalence of isolates with physicochemical factors among different sources of water. A significant association between prevalence and temperature was found in industrial effluent (p = 0.04), municipal wastewater (p = 0.01), river water (p = 0.03), lake water (p = 0.01), pond water (p = 0.005) and irrigation water (p = 0.01) (Table 1). However, the pH of the river (p = 0.01), canal (p = 0.04), and lake water (p < 0.001) were significantly associated with bacterial prevalence. Further, we found a significant association (p ≤ 0.05) of the prevalence of enteric bacteria with DO, BOD, and COD in the majority of water sources.
Propionate frequency of enteric bacteria in water sources
Among the bacterial isolates detected, E. coli was the most prevalent (29.68%, 46 of 155) followed by Vibrio cholerae (27.74%, 43 of 155), Shigella spp. (22.58%, 35 of 155), and Salmonella spp. (20.00%, 31 of 155), respectively (Supplementary Fig. 1 part A).
The highest frequency of bacterial isolates was found in hospital wastewater (26%-31%), followed by municipal wastewater (15–23%), canal water (13–20%), and industrial effluent (11–17%), respectively. The lowest frequency of bacterial isolates was detected in Lake water (0–4%), followed by irrigation water (2–3%), pond water (3–8%), and river water (9–13%), respectively (Supplementary Fig. 1 part B).
Resistant bacteria are widely distributed in water sources
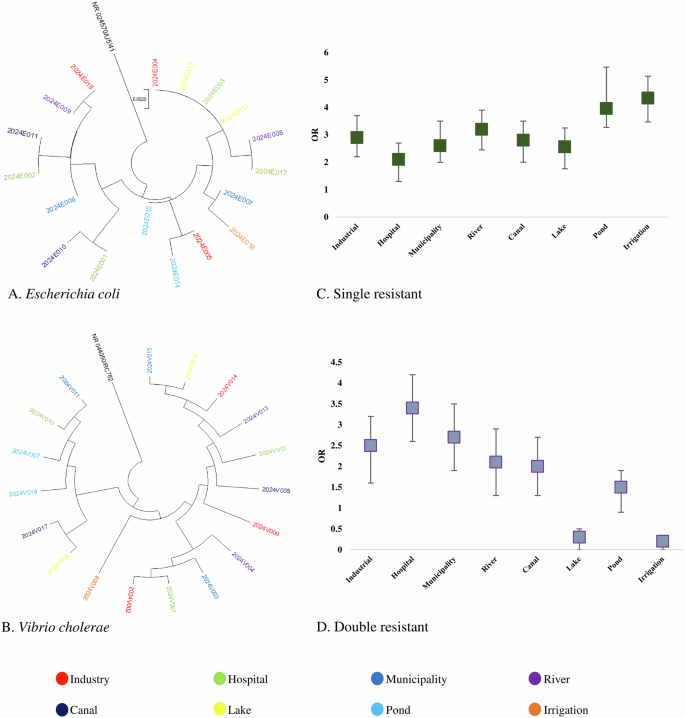
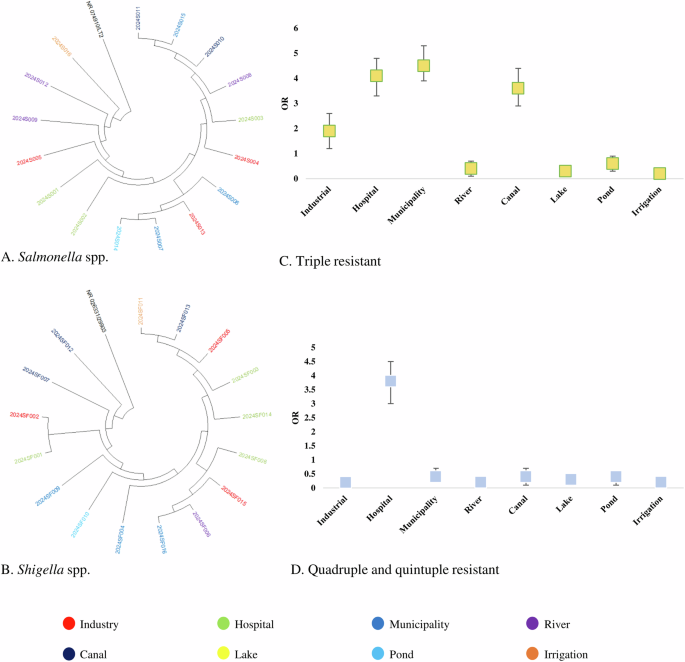
Partial amplicons of 16S rRNA and specific resistant genes were used to determine the species of resistance gene-carrying isolates. The detailed protocol is previously published elsewhere. Multiple sequence alignment (MSA) was conducted by using ClustalW and trees were built by using the maximum likelihood method following 1000 bootstrap values. We randomly selected 18 amplicons of E coli, 18 amplicons of V. cholerae, 16 amplicons of Salmonella spp., and 16 amplicons of Shigella spp. from both phenotype and genotype-resistant isolates for phylogenetic analysis. These 16S rRNA-based trees showed that circulating isolates of enteric bacteria in Bangladesh during recent times are highly similar across different sources. Isolates of E coli and V. cholerae from hospital wastewater and industrial effluent were closely related to isolates from lakes, rivers, and pond water (> 99.8% similarity; <0.002 divergence) (Fig. 2A, B). Further, isolates of Salmonella spp., and Shigella spp. from ponds, rivers, and canals clustered closely with the isolates of municipality and hospital wastewater (> 99.5% similarity; <0.005 divergence) (Fig. 3A, B).
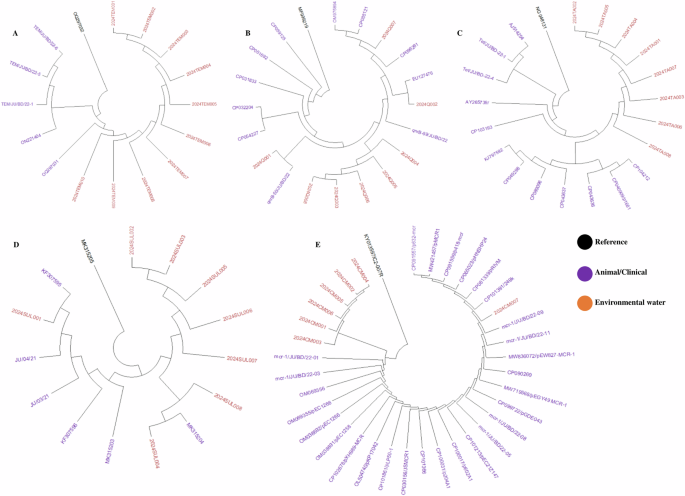
We used 40 amplicons of antibiotic-resistant genes including blaTEM, qnrB, tetA, mcr-1, and sul-1. We found that resistant genes from environmental sources were closely related to widely distributed resistant genes in enteric bacteria isolated from animals and humans in recent times in Bangladesh. Our study-resistant genes including blaTEM, qnrB, tetA, mcr-1, and sul-1 were highly similar (> 99.5% similarity; <0.002 divergences) with previously reported resistant genes isolated from clinical and environmental strains (Fig. 4).
Association of MDR isolates with the sources of isolation
Odds of prevalence of single resistant bacteria were higher in irrigation water (OR: 4.34, 95% CI: 3.56–4.98), followed by pond water (OR: 3.96, 95% CI: 3.18–4.85), river water (OR: 3.21, 95% CI: 2.38–3.92), industrial effluent (OR: 2.91, 95% CI: 2.21–3.72) and canal water (OR: 2.83, 95% CI: 1.98–3.61), respectively (Fig. 2C). We found significantly higher odds of prevalence of double resistant bacteria in hospital wastewater (OR: 3.43, 95% CI: 2.68–4.29), followed by municipality wastewater (OR: 2.72, 95% CI: 1.95–3.63), industrial effluent (OR: 2.52, 95% CI: 1.68–3.34) and river water (OR: 2.17, 95% CI: 1.46–3.06), respectively (Fig. 2D). Higher odds of triple resistance were prevalent among bacteria in municipality wastewater (OR: 4.53, 95% CI: 4.13–5.25), hospital wastewater (OR: 4.16, 95% CI: 3.57–4.98), canal water (OR: 3.65, 95% CI: 3.11–4.26) and industrial effluent (OR: 1.93, 95% CI: 1.15–2.72) (Fig. 3C). Further, we found higher odds of quadruple and quintuple resistance only in hospital wastewater (OR: 3.86, 95% CI: 3.17–4.61) (Fig. 3D). The odds of prevalence of MDR bacteria were significantly lower ( < 1) in rivers, lakes, ponds, and irrigation water (Fig. 2C, D).
Prevalence of AMR isolates associated with sources
Multivariable logistic models were used and clustered at the source level to assess the source factors associated with the detection of phenotypic antimicrobial-resistant isolates. Primary outcomes included being resistant to an antibiotic(s) (1) or being sensitive (0). Models were defined for all ten resistance phenotypes. The findings were restricted to only statistically significant variables. Odds above 1 indicate increased odds of resistance in specific sources and <1 decreased odds of isolates with phenotypic resistance.
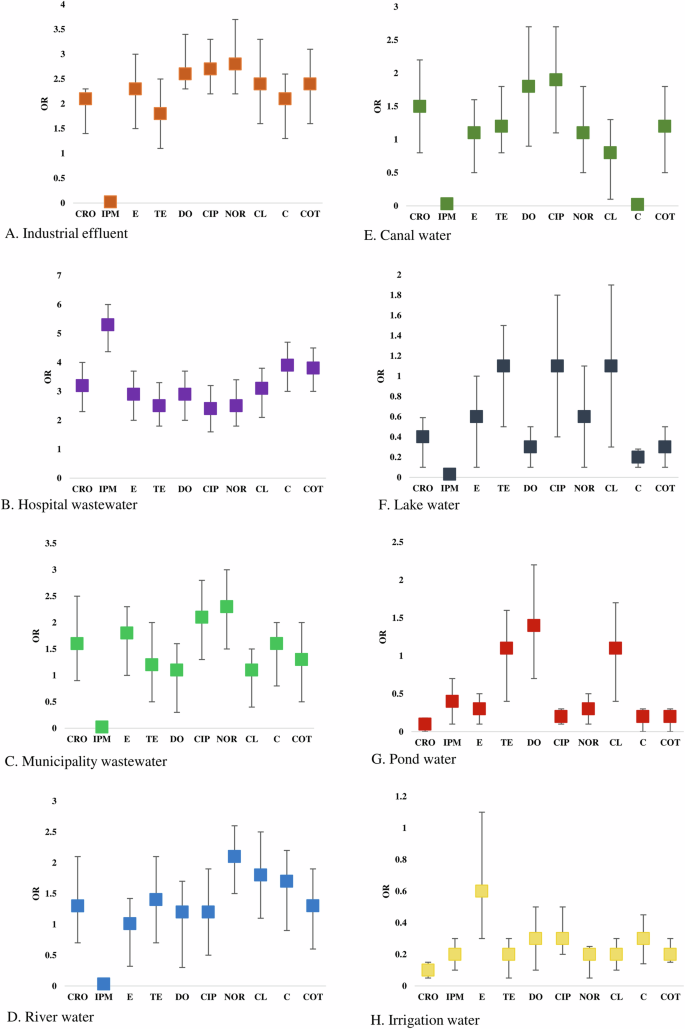
Higher odds of ceftriaxone-resistant phenotypes were present among enteric bacteria circulating in hospital wastewater (OR: 3.21, 95% CI: 2.36–3.95), followed by industrial effluent (OR: 2.15, 95% CI: 1.66–2.38), and municipal wastewater (OR: 1.64, 95% CI: 0.92–2.48), respectively. Significantly higher odds of imipenem-resistant isolates were only found in hospital wastewater (OR: 5.34, 95% CI: 4.48–5.97) (Fig. 5). Erythromycin-resistant bacteria were circulating in the majority of the water sources. However, the highest odds of prevalence were found in hospital wastewater (OR: 2.93, 95% CI: 2.15–3.76), followed by industrial effluent (OR: 2.32, 95% CI: 1.51–3.13). Isolates in hospital wastewater had higher odds of phenotypic resistance to tetracycline (OR: 2.53, 95% CI: 1.94–3.13), doxycycline (OR: 2.91, 95% CI: 2.15–3.74), chloramphenicol (OR: 3.15, 95% CI: 2.28–3.78), colistin (OR: 3.94, 95% CI: 3.08–4.63) and cotrimoxazole (OR: 3.81, 95% CI: 2.97–4.51) than any other sources (Fig. 5). Bacterial isolates from industrial effluent had the highest odds of resistance against ciprofloxacin (OR: 2.72, 95% CI: 2.97–4.51) and norfloxacin (OR: 2.84, 95% CI: 2.97–4.51). Further, higher odds of prevalence of norfloxacin and ciprofloxacin-resistant bacteria were found in municipal wastewater (OR: 2.31, 95% CI: 1.56–3.03 and OR: 2.14, 95% CI: 1.47–2.75) and river water (OR: 2.16, 95% CI: 1.43–2.67) (Fig. 5).
Antimicrobial resistance pattern of the enteric bacteria
Among the isolates of E. coli, the highest frequency of resistance was observed to ceftriaxone (46.65%, 21 of 46) and erythromycin (46.65%, 21 of 46), and followed by tetracycline (26.09%, 12 of 46), and chloramphenicol (23.91%, 11 of 46), doxycycline (22%, 10 of 46), ciprofloxacin (22%, 10 of 46) and norfloxacin (20%, 9 of 46), respectively. Conversely, isolates of E. coli showed the highest frequency of sensitivity to imipenem (95.65%, 44 of 46), and colistin (78.26%, 36 of 46) (Table 2). Isolates of V. cholerae were less resistant than the isolates of E. coli against all the tested antibiotics. The highest percentage of resistance was found to erythromycin (41.86%, 18 of 43), followed by ceftriaxone (35%, 15 of 43), tetracycline (23%, 10 of 43), doxycycline (19%, 8 of 43), ciprofloxacin (14%, 6 of 43) and norfloxacin (14%, 6 of 43), respectively (Table 2).
The majority of the isolates of Salmonella spp. were resistant against ceftriaxone (35.48%, 11 of 31), followed by erythromycin (29%, 9 of 31), tetracycline (23%, 7 of 31), and ciprofloxacin (19%, 6 of 31), respectively, while higher frequency of sensitivity was found against colistin and (90.32%, 28 of 31) and imipenem (96.77%, 30 of 31). Similarly, the isolates of Shigella spp. exhibited a higher frequency of resistance against ceftriaxone (42.86%, 15 of 35), erythromycin (40%, 14 of 35), and tetracycline (28.57, 10 of 35) (Table 2).
Comparative antibiotic resistance profile of the isolates
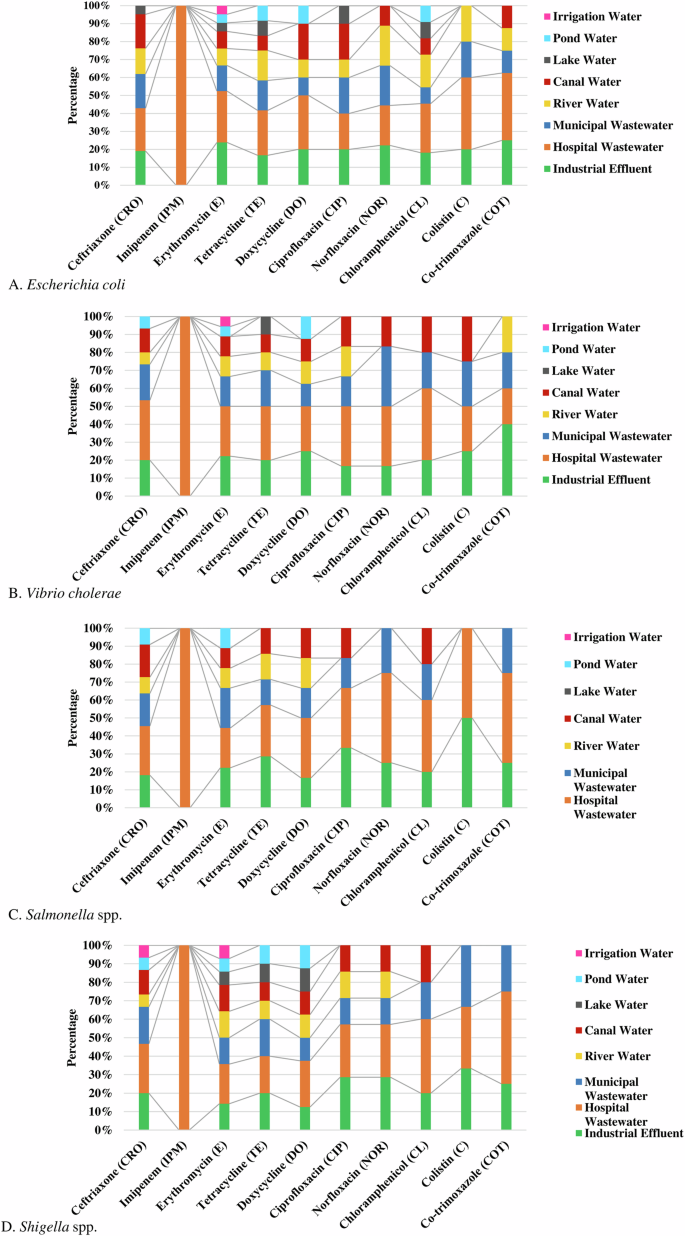
Among the enteric bacteria, E. coli isolated from hospital wastewater showed the highest frequency (35%, 95% CI 20–100%) of phenotypic resistant followed by industrial effluent (18.5%, 95% CI 0–25%), municipal wastewater (14.3%, 95% CI 0–22%), river water (13.3%, 95% CI 0–22%), and canal water (10.9%, 95% CI 0–20%), respectively against the tested antibiotics. Isolates of E. coli in hospital wastewater were most resistant against imipenem (100%), followed by colistin (40%), cotrimoxazole (37.5%), doxycycline (30%), and erythromycin (28.6%), respectively (Fig. 6A).
Isolates of V. cholerae from hospital wastewater (37%, 95% CI 20–100%) showed the highest frequency of resistance followed by industrial effluent (20.5%, 95% CI 0–40%), municipal wastewater (18.4%, 95% CI 0–33%) and canal water (12.5%, 95% CI 0–25%), respectively. Significant frequency of V. cholerae in hospital wastewater and industrial effluent were resistant against chloramphenicol (40%) and colistin (40%) (Fig. 6B).
Salmonella spp. in hospital wastewater (43.5%, 95% CI 22–100%) showed the highest frequency of resistance, followed by industrial effluent (23.9%, 95% CI 0–50%), and municipal wastewater (15.8%, 95% CI 0–25%), respectively. About 50% of the isolates of Salmonella spp. in hospital wastewater were resistant to norfloxacin, cotrimoxazole, and colistin (Fig. 6C). Similarly, a higher frequency of resistant Shigella spp. was isolated from hospital wastewater (37.5%, 95% CI 20–100%), industrial effluent (20.3%, 95% CI 0–33%), and municipal wastewater (17.3%, 95% CI 0–33%), respectively (Fig. 6D).
About 100% of the enteric bacteria in hospital wastewater were resistant to imipenem, while bacterial isolates (100%) from all other water sources were highly sensitive to imipenem (Fig. 6). Isolates of enteric bacteria resistant against colistin were commonly found in hospital wastewater (37%, 95% CI 25–50%), industrial effluent (32%, 95% CI 20–50%), municipal wastewater (19.5%, 95% CI 0–33%). Resistant isolates against erythromycin were widely distributed in the majority (95%) of the water sources. The majority of the enteric bacteria (90%) in pond, lake, and irrigation water were sensitive to the tested antibiotics (Fig. 6).
Prevalence of multidrug resistance enteric bacteria
Multidrug resistance (MDR) was defined as phenotypic or genotypic resistance of a single isolate to more than three groups of antibiotics. We found MDR isolates against cephem (ceftriaxone), macrolides (erythromycin), tetracyclines (tetracycline), cotrimoxazole and phenicol (chloramphenicol).
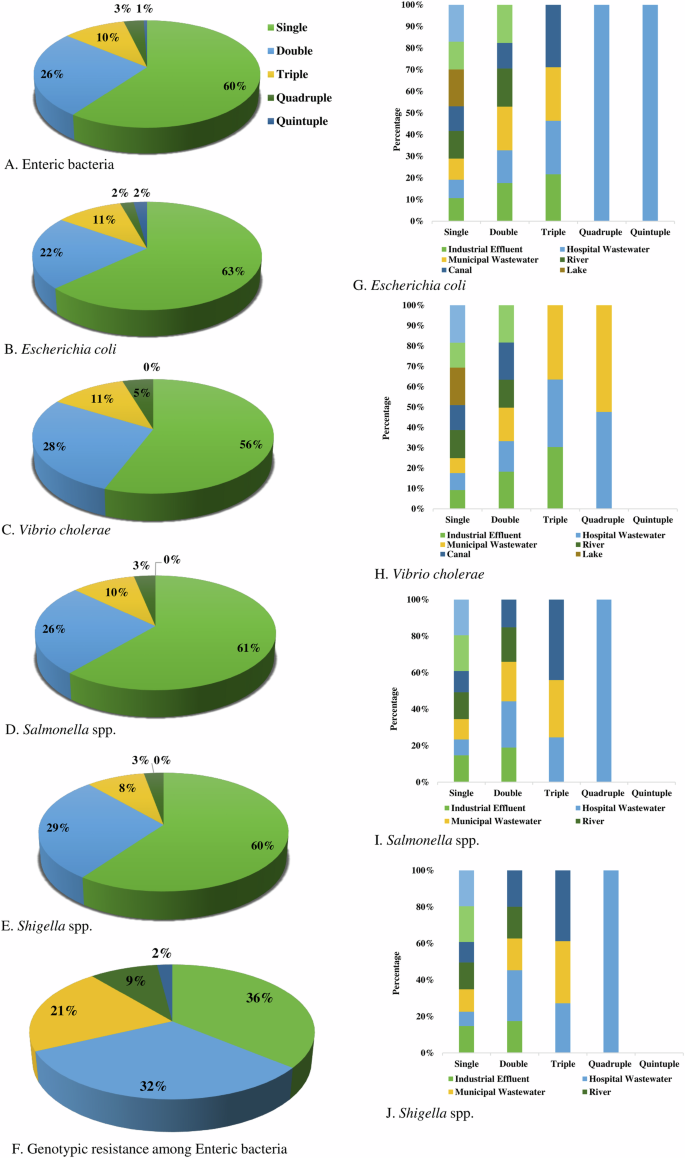
We found about 60% of enteric bacteria were resistant to a single group of antibiotics, followed by double (26%), triple (10%), quadruple (3%) and quintuple (1%) resistant, respectively (Fig. 7A). Overall, MDR in phenotype was found among 14% of bacteria. Phenotypic resistance against two groups of antibiotics was detected at the highest frequency in Shigella spp. (29%), followed by V. cholerae (28%), Salmonella spp. (26%) and E. coli (22%), respectively. Multidrug resistance including triple, quadruple, and quintuple resistance was found in highest prevalence in E. coli (15%), V. cholerae (15%), followed by Salmonella spp. (13%) and Shigella spp. (11%), respectively (Fig. 7).
Proportionate frequency of multidrug-resistant phenotype in (A) Enteric bacteria, (B) Escherichia coli, (C) Vibrio cholerae, (D) Salmonella spp., (E) Shigella spp. and (F). Genotypic resistant isolates, and comparative frequency of multidrug-resistant (G). Escherichia coli, (H) Vibrio cholerae, (I) Salmonella spp., and (J) Shigella spp. in different water sources.
The prevalence of genotypic resistance among bacterial isolates was determined by the presence of specific resistant genes. Single resistance (36%) was most frequent followed by double (32%), triple (21%), quadruple (9%), and quintuple (2%), respectively (Fig. 7F).
Distribution of MDR isolates in water sources
Multidrug-resistant E. coli isolates were most prevalent in hospital wastewater, with approximately 7.14% exhibiting both quadruple and quintuple resistance, and about 14.29% showing triple resistance. In canal water, around 16.67% of the isolates showed triple resistance, while in municipal wastewater, nearly 14.29% of isolates displayed triple resistance. In industrial effluent, almost 12.50% of isolates exhibited triple resistance (Fig. 7G).
Multidrug-resistant V. cholerae isolates were most prevalent in municipal and hospital wastewater. In municipal wastewater, approximately 20% of isolates showed triple resistance, while about 10% exhibited quadruple resistance. In hospital wastewater, around 18.18% of isolates demonstrated triple resistance, and nearly 9.09% displayed quadruple resistance. Approximately 27% of isolates in industrial effluent showed triple resistance (Fig. 7H).
Multidrug-resistant Salmonella spp. isolates were most prevalent in hospital wastewater, with about 11.11% exhibiting both triple and quadruple resistance. In canal water, around 20% of isolates showed triple resistance, while approximately 14% of isolates in municipal wastewater exhibited triple resistance (Fig. 7I).
Multidrug-resistance Shigella spp. isolates were most prevalent in hospital wastewater, with about 10% exhibiting both triple and quadruple resistance. In canal water, around 14.29% of isolates showed triple resistance, while approximately 12.50% of isolates in municipal wastewater exhibited triple resistance (Fig. 7J).
Association of phenotypic and genotypic resistance
The prevalence and association of phenotypic and genotypic resistance among the enteric bacterial isolates were evaluated. We found resistant genotype against quinolones (qnr genes), β-Lactams (blaTEM, blaCTX-M-15, blaOXA), and antagonists of the folate pathway (co-trimoxazole-sul-1 genes), tetracycline and colistin. The highest prevalence of resistant genotype was found against β-lactams (30%-37%), followed by ciprofloxacin (23%-31%), tetracycline (13%-24%), cotrimoxazole (11%-13%), and colistin (3%-10%), respectively (Table 3).
We wanted to determine if the presence of these resistance genes was associated with phenotypic resistance among these bacterial isolates. We found a significant association between the prevalence of genotype and phenotype resistance among the enteric isolates. A significant association was observed between phenotypic and genotypic resistance among the isolates of E. coli for ceftriaxone (p = 0.04), ciprofloxacin (p = 0.002), tetracycline (p = 0.005), cotrimoxazole (p = 0.001) and colistin (p = 0.005). Similarly, among the isolates of V. cholerae, Salmonella spp., and Shigella spp., the association of phenotypic and genotypic resistance was statistically significant (p value ≤ 0.05) (Table 3).

