Study design
We conducted a cross-sectional study to assess the socioeconomic and health vulnerability of the slum dwellers in Dhaka, Bangladesh. Data were collected through a household survey between November and December 2021.
Study setting
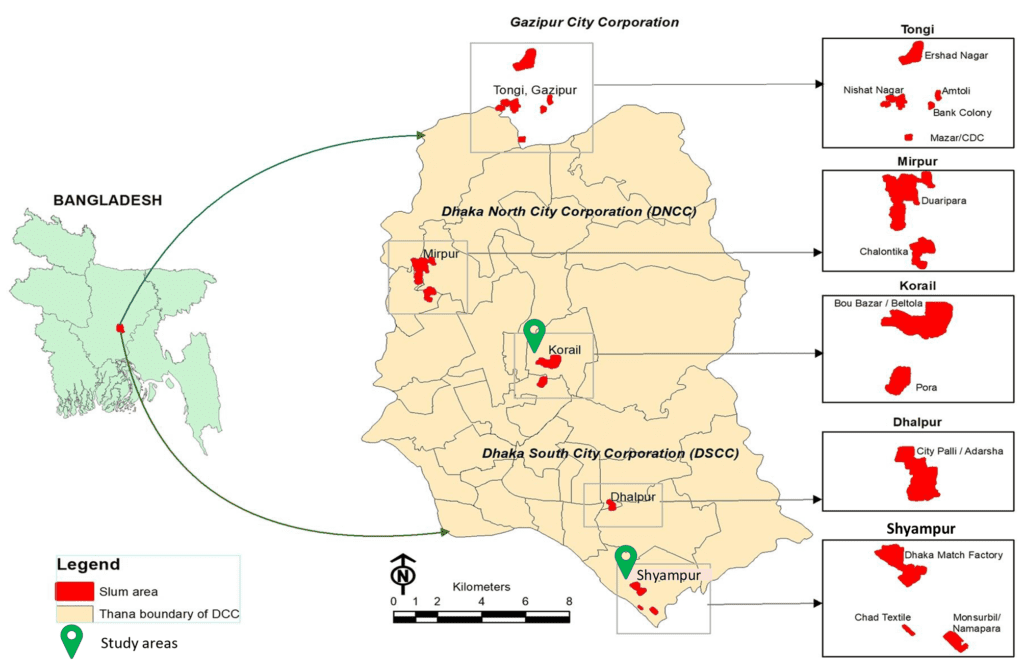
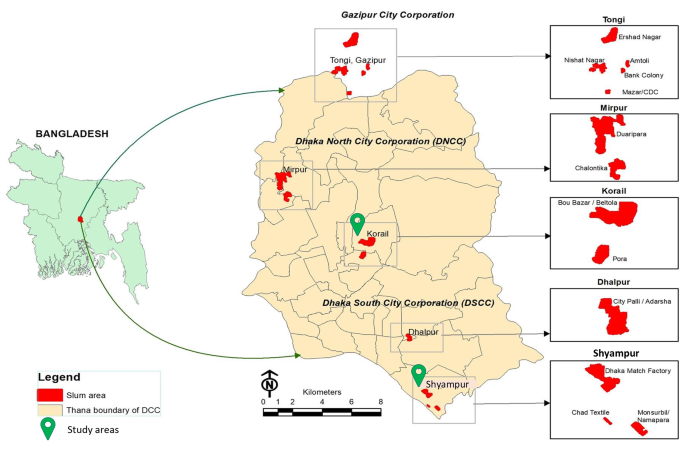
The study was conducted in two purposively selected slums of Dhaka, Bangladesh. icddr, b established an urban health and demographic surveillance system (UHDSS) including five slums, namely, Korail, Mirpur, Shayampur, Dhalpur, and Tongi-Ershadnagar [25]. Among them, Korail and Mirpur are located under the Dhaka North City Corporation (DNCC), Shayampur, and Dhalpur under the Dhaka South City Corporation (DSCC), and Tongi-Ershadnagar under the Gazipur City Corporation (GCC). Since our study area was Dhaka, we purposively selected Korail slum from DNCC and Shyampur slum from DSCC (Fig. 1) on the basis of several aspects, such as infrastructure, access to services, location, and living standards for a better understanding of the overall socioeconomic and health vulnerability in order to capture the diversity of experiences and vulnerabilities across slum areas [25].
Study areas adapted from Razzaque et al., 2023 [26]
Study population
The population living in slums was considered the study population in this study. The study population included the following set of inclusion criteria: (i) living in selected slums; (ii) living in slums for at least 12 months preceding the survey; (iii) age of respondents at least 18 years; and (iv) agreed to participate in the study.
Socioeconomic and health vulnerability index
The index used to measure socioeconomic and health vulnerability in the study was adopted from the socioeconomic and health vulnerability index (SEHVI). The SEHVI is a composite index built with several indicators related to demographics, socioeconomics, health determinants, and health outcomes [18, 20, 27]. The index was initially designed to align with the goals of the United Nations 2030 Agenda for Sustainable Development which helps to identify the socioeconomic and environmental determinants affecting health and wellbeing [28]. The index was modified and contextualized for the urban slums of Bangladesh and adopted as SEHVI-BD. Given that this index has not been previously applied in the urban slum context of Bangladesh, the reliability of the outcome measures was validated against a recognized indicator. For example, individuals in higher asset quintiles are less prone to experiencing high levels of vulnerability.
Selection of indicators
We included the selected indicators due to their relevance in understanding the multifaceted nature of socioeconomic and health vulnerabilities among urban slum dwellers in Bangladesh. Further, several domains related to the health and socioeconomic condition of households were considered for the inclusion of factors or indicators. A total of 54 indicators (Supplementary Table 1) from the different domains were identified on the basis of a literature review and expert consultations for potential inclusion into the SEHVI-BD index [18, 21, 25, 27,28,29,30]. Indicators such as “Household head is a female” and “Head of the house in your family is a widow” are crucial for capturing gender-based vulnerabilities, which often exacerbate socioeconomic challenges. Ownership and quality of housing, as well as access to basic services like electricity, water, gas, and sanitation, are essential indicators of living conditions and infrastructure deficits, which directly impact health outcomes. Indicators related to income, employment, and financial stability, such as “Household has a regular income” and “Household currently has financial debt,” provide insight into economic vulnerability and the capacity to cope with financial shocks. Access to healthcare and education, as well as social safety nets, highlight disparities in service availability and utilization, which are critical for long-term well-being. Furthermore, indicators addressing safety, crime, domestic violence, and environmental conditions reflect the broader social determinants of health that influence both physical and mental health outcomes. By examining and incorporating these diverse indicators, we aimed to develop the SEHVI-BD index to provide a comprehensive assessment of the vulnerabilities faced by slum dwellers in Bangladesh.
Sample size
The following formula was used to estimate the sample size. Where, n = the number of households to be interviewed; p = proportion of households vulnerable to socioeconomic and health factors (50%); zα/2 = level of confidence (1.96); d = precision (5%); df = design effect (1.5); and α = nonresponse rate (30%). Using the standard parameters, the sample size was estimated to be 384 households. After adjusting for a design effect and nonresponse rates, the sample size increased to 824.
$$\:n=\left[\frac{{z}_{\frac{\alpha\:}{2}}^{2}p\left(1-p\right)}{{d}^{2}}*df\right]/\alpha\:$$
We utilized this formula to estimate the sample size for measuring the proportion of vulnerable populations in the selected slums. Since there were no available prevalence statistics on socioeconomic and health vulnerability in Bangladesh or comparable settings, we made an assumption that 50% of the slum population would exhibit vulnerability. The assumption of 50% prevalence maximizes the required sample size, ensuring that the study would be adequately powered even if the actual prevalence deviated from this estimate. A confidence level of 95% (zα/2 = 1.96) was chosen to ensure the findings were statistically significant, and a precision level (d) of 5% was selected to minimize the margin of error. Additionally, given that we surveyed households in two slums, a design effect (df) of 1.5 was applied to account for the increased variability due to clustering within slums. This helped ensure the sample size was sufficient to accommodate variations within and between the selected slums. Finally, a nonresponse rate of 30% was taken into account for potential challenges in data collection during the pandemic, including accessibility to households and interview refusals.
Sampling method
We expected that the selected slums would be different in the level of vulnerability. Moreover, there is a large difference in household numbers between the selected slums. Considering these facts, we aimed to ensure a representative sample from each of the selected slums to generate and compare slum-level vulnerability. Thus, we distributed the estimated sample size equally between the two slums where each of the slums fulfilled the minimum sample size (n = 384) requirement. We followed a systematic random sampling method to select the households for the survey. We approached the adult household members from the selected households to participate in the study. Recent evidence indicates that approximately 14,000 and 2,300 households live in the Korail and Shyampur slums, respectively [25]. For Korail, we used an interval of 34 (14,000/412) to select households, while for Shyampur, we used an interval of 6 (2,300/412, rounded). The UHDSS authority divided the Korail and Shyampur slums into clusters and assigned ID numbers to each household in each cluster. To avoid duplication and ensure full coverage, our Field Research Assistants began approaching households from randomly selected points in the slums based on these household IDs and continued the process of maintaining the household interval until the required number of interviews was conducted in each area. If a selected household had more than one eligible member, one was chosen randomly via the lottery method. On the other hand, if there was no eligible member in the selected household during the visit, the subsequent household was approached until an eligible participant was found. A total of 824 households were approached during the data collection period, of which 810 were successfully interviewed. Fourteen eligible households did not participate in interviews due to personal or family issues, resulting in a 93% response rate. All 810 completed interviews (406 from Korail and 404 from Shyampur slum) were included in the analysis.
Study instrument, data collection, and management
Initially, we developed an English questionnaire on the basis of a literature review [18, 21, 25, 27,28,29,30] and consultation with experts. For ease of understanding by the interviewers and interviewees, the questionnaire was later translated into Bengali. The questionnaire underwent pretesting to assess and refine its phrasing, structure, length, and sequencing; subsequently, it was revised on the basis of pretesting feedback before being adapted for data collection via electronic tablets. Data were collected through face-to-face interviews using an electronic device-based data collection system called KoboToolbox. We recruited eight Field Research Assistants and one Field Research Supervisor, each with at least three years of relevant experience and a minimum of a bachelor’s degree. Further, they were provided a five-day hands-on training for collecting data, cross-checking, and submission of the online form. They were also given a brief on the objective and ethical issues of the study. The collected data were kept under an encrypted system with password protection. The icddr, b policy was followed to properly access and safeguard data confidentiality. All electronic copies of the collected data were stored in the icddr, b data repository after the completion of the study.
Data analysis
Both descriptive and inferential statistical analyses were performed. Using Cronbach’s alpha test, we identified the indicators that maintained the internal consistency to finalize the index [31]. Furthermore, the Kaiser–Meyer–Olkin measure of sampling adequacy and Bartlett’s test were used to confirm the relationship between indicators and to verify whether the matrix of correlations in the population was an identity matrix [32, 33]. We followed principal component factor (PCF) analysis to construct the SEHVI-BD index with indicators that upheld an acceptable threshold of Cronbach’s alpha (≥ 0.7) [31]. PCF analysis has been extensively employed and empirically verified in the field of multidimensional poverty studies as a method for reducing data dimensionality while examining a series of binary variables [34]. The selected indicators were coded as dummy variables with a value of 1 or 0. All indicators were categorized as negative or positive on the basis of their influence on the socioeconomic and health conditions of households. The negative attributes were assigned a value of 1 and the positive were a value of 0. For example, “availability of secondary education service” is considered to have a positive impact on socioeconomic and health outcomes and therefore was identified as a positive indicator and was assigned a value of ‘0’.
On the basis of the relevance of the indicators, we grouped them into several domains. After the formation of the domain, we calculated domain-specific and overall mean scores on a scale of 100. This approach was used elsewhere to obtain a balanced score instead [35]. The index values were then divided into three quantiles which we identified as mild (bottom 33% with the lowest index value), moderate (middle 33%), and severe vulnerability (top 33% with the highest index value). Furthermore, the differences in vulnerability between slums and the associations between vulnerability levels and different socioeconomic variables were tested by the Mann-Whitney U test (compare the mean values) the Kruskal-Wallis test (measure the statistically significant differences between two or more groups of independent variables). A p-value less than 0.05 was considered statistically significant. We analyzed the data using Stata SE, version 15.


