Spatial distribution meteorological drought vulnerability factors
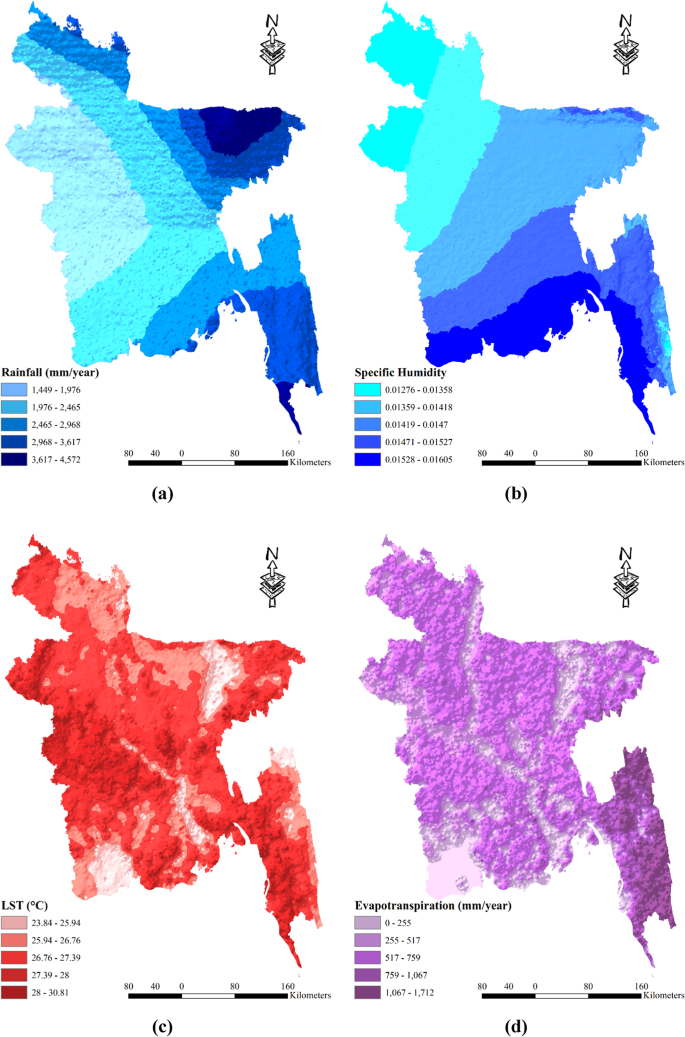
The probability of drought in Bangladesh is inversely related to the amount of rainfall received. Rainfall data from 2001 to 2022 indicates a range of 1449 to 4572 mm per year, which is divided into five zones based on rainfall levels. The zones are as follows: 1449-1976 mm, 1976-2465 mm, 2465-2968 mm, 2968-3617 mm, and 3617-4572 mm. Among the regions, Rajshahi receives the least amount of rainfall, while Sylhet receives the highest (as depicted in Fig. 3 (a)). Higher humidity levels contribute to reduced evaporation and subsequently decrease the likelihood of drought. Specific humidity measurements in Bangladesh from 2001 to 2022 range from 0.01276 to 0.01605 and are categorized into five zones: 0.01276–0.01358, 0.01359–0.01418, 0.01419–0.0147, 0.01471–0.01527, and 0.01528–0.01605. The coastal regions of Bangladesh generally exhibit greater specific humidity compared to the northwestern regions (as illustrated in Fig. 3 (b)). Elevated temperatures exacerbate the occurrence and severity of drought. The average land surface temperature (LST) in Bangladesh during the period from 2000 to 2022 varies from 23.84 °C to 30.81 °C. The LST values are divided into five zones: (23.84–25.94 °C, 25.94–26.76 °C, 26.76–27.39 °C, 27.39–28 °C, and 28–30.81 °C). Regions near Jashore, Chuadanga, and Meherpur experience comparatively higher temperatures (as shown in Fig. 3 (c)). Drought-prone areas often exhibit higher rates of evapotranspiration. The average evapotranspiration (ET) in Bangladesh between 2001 and 2022 ranges from 0 to 1712 mm per year and is classified into five zones: (0–255 mm, 255–517 mm, 517–759 mm, 759–1067 mm, and 1067–1712 mm). Hilly regions, characterized by a greater amount of vegetation, tend to have higher rates of evapotranspiration (as depicted in Fig. 3 (d)). Overall, understanding the interplay between rainfall, humidity, temperature, and evapotranspiration is crucial for assessing the probability of drought in different regions of Bangladesh. These factors provide valuable insights for developing effective drought mitigation strategies and resource management practices in the country.
Spatial distribution meteorological drought vulnerability factors: (a) Rainfall; (b) Specific Humidity; (c) Land Surface Temperature; (d) Evapotranspiration; prepared by the authors using ArcGIS software version 10.5, (https://www.esri.com/en-us/arcgis/products).
Spatial distribution agricultural drought vulnerability factors
Bangladesh exhibits a varying curvature across its landscape, ranging from -12.6 to 15.7. To classify these curvature values, four distinct classes are employed: -12.6 to -0.296, -0.296 to 0.0361, 0.0361 to 0.701, and 0.701 to 15.7 (as depicted in Fig. 4 (a)). When considering land cover categories, high-intensity development is prevalent throughout the country, while forested areas are primarily concentrated in the southeastern part of Bangladesh, encompassing the Chittagong Hill Tracts. In districts like Meherpur, Chuadanga, and Kushtia (as shown in Fig. 4 (b)), one can observe low-intensity development. The land cover also includes water bodies. Examining the soil types within the study area, Bangladesh comprises predominantly silt, loam, clay, and brown/gray soils. However, the proportion of silt and clay is relatively lower. Clay soil can be found in districts such as Kushtia, Rajbari, Faridpur, Magura, Jessore, Meherpur, Chuadanga, and Sylhet. Grey soil is prominent in the Chittagong division and districts like Sunamganj, Habiganj, Thakurgaon, and Panchagarh. Additionally, the districts adjacent to the Jamuna River feature a combination of silt, loam, and clay soils (as illustrated in Fig. 4 (c)). The soil texture in Bangladesh, represented in Fig. 4 (d), exhibits a range from 0.11 to 0.89 and is classified into four zones: 0.11–0.29, 0.29–0.48, 0.48–0.68, and 0.68–0.89 (Table 2). Notably, the hilly regions of Bangladesh demonstrate higher soil texture values. Geographically, Bangladesh comprises various classes, including alluvium, Miocene, Pleistocene, and Pliocene, as shown in Fig. 4 (e). The hilly region predominantly consists of Miocene soil, whereas alluvium types are prevalent throughout the country. Pleistocene soil can be found in districts such as Nawabganj, Rajshahi, Gazipur, and Narsingdi. In terms of morphology, Bangladesh encompasses different classes such as water bodies, hills, vast plains, and valleys. The hills are primarily located in the southeast region, while the majority of the country features valleys and ridges. Water bodies and terraces are prominent in the main rivers and the southwestern part of the region (as depicted in Fig. 4 (f)). Figure 4 (g) also presents the Normalized Difference Vegetation Index (NDVI. Positive NDVI values indicate areas with dense vegetation, while near-zero or negative values represent water and built-up areas. NDVI is an efficient indication of vegetative stress, making it useful for monitoring crops. NDVI values are connected with agricultural drought vulnerability because they show unhealthy vegetation. In contrast, during drought circumstances, water stress impairs plant physiology, resulting in lower water content, chlorophyll activity, and, as a result, lower NDVI values85. In the context of drought vulnerability, low NDVI values indicate the impact of water scarcity on crops, revealing reduced yields and compromised agricultural output. However, the interpretation should be nuanced, taking into account unique crop traits, soil conditions, and environmental influences86. The NDVI is categorized into four zones: less than 0.20, 0.2 to 0.42, 0.42 to 0.60, and 0.60 to 0.80. Figure 4 (h) shows the Crop Intensity across Bangladesh. It can be said crop intensity is heterogeneous across the country. Districts like Shylet, Khulna, and Chittagong shows low levels of intensity. Finally, Fig. 4 (i) shows the most used Irrigation system across the country Overall, these various characteristics provide valuable insights into the diverse environmental features of Bangladesh, including its curvature, land cover, soil types, soil texture, geographic classes, and morphological classes.
Spatial distribution agricultural drought vulnerability factors: (a) Curvature; (b) Land Cover; (c) Soil Type; (d) Soil Texture; (e) Geology; (f) Morphology; (g) Normalized Difference Vegetation Index (h) Crop Intensity (i) Most used Irrigation system; prepared by the authors using ArcGIS software version 10.5, (https://www.esri.com/en-us/arcgis/products).
Spatial distribution hydrological drought vulnerability factors
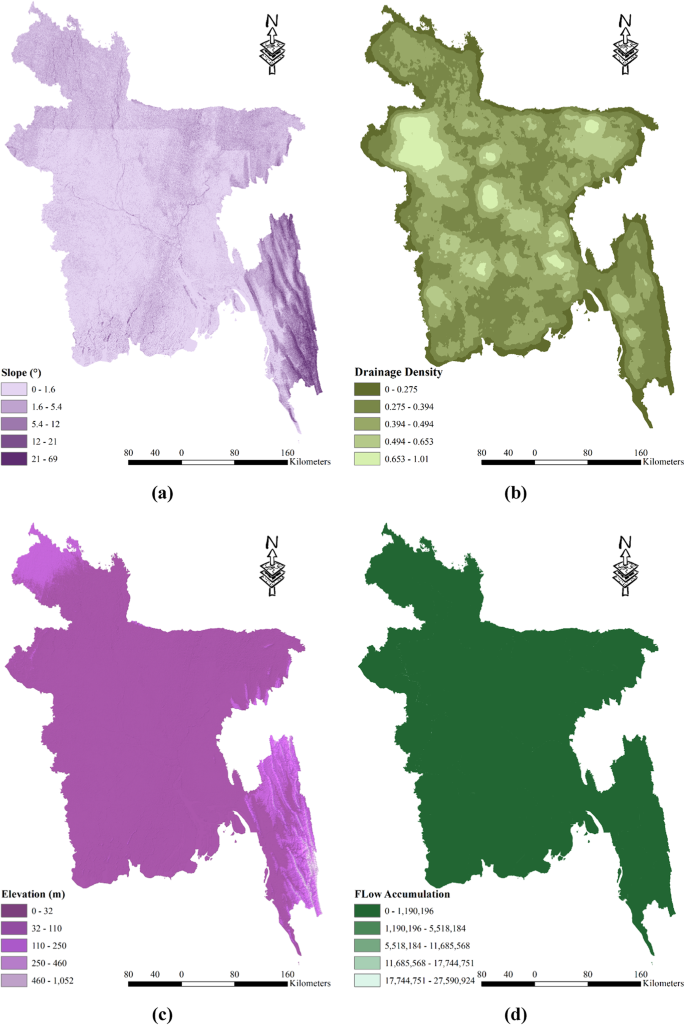
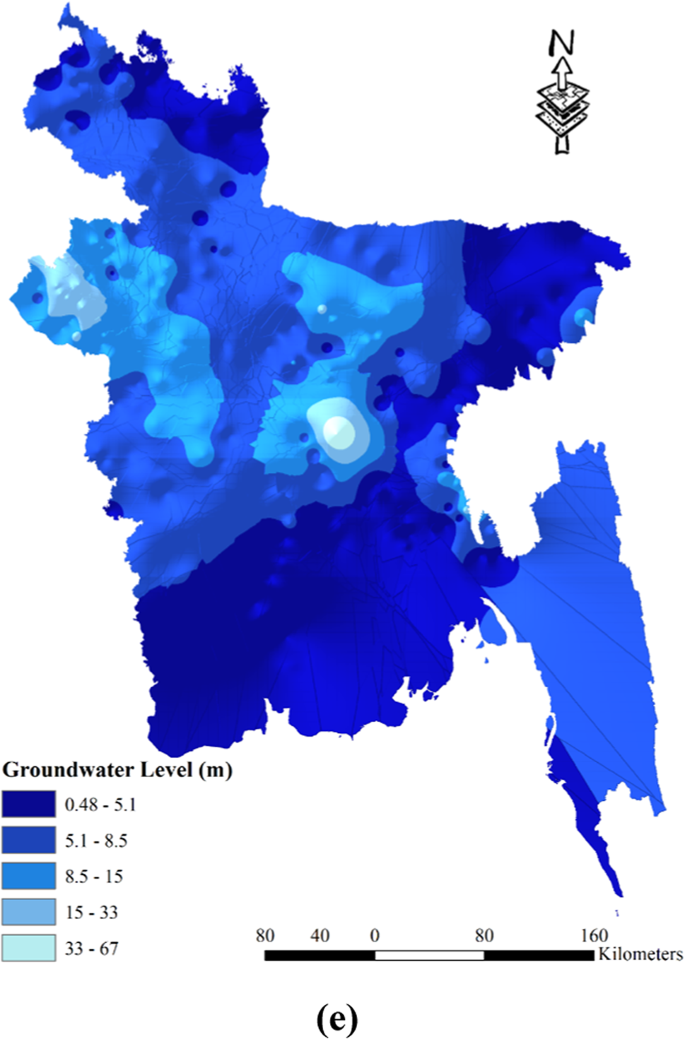
The severity of drought in Bangladesh can be influenced by various hydrological factors. One such factor is the slope of the land, which plays a significant role. Steeper slopes tend to exacerbate drought conditions. In Bangladesh, slopes are classified into five zones based on their angle: 0–1.6°, 1.6–5.4°, 5.4–12°, 12–21°, and 21–69°. Notably, the hilly areas of Chittagong exhibit a steeper slope compared to other parts of the country (refer to Fig. 5 (a)). Another contributing factor is the drainage density, as illustrated in Fig. 5 (b). Locations with lower drainage density are more prone to experiencing drought. Drainage density is categorized into five zones: 0–0.275, 0.275–0.394, 0.394–0.494, 0.494–0.653, and 0.653–1.01. The western part of the country, encompassing districts like Naogoan, Rajshahi, and Natore, has relatively high drainage density. Similarly, districts in the eastern part, including Sunamgonj, Sylhet, and Habigonj, also exhibit high drainage density. However, the districts in the Chittagong division, especially those in the hilly tracks, have lower levels of drainage density. Elevation is yet another influential factor in drought susceptibility, with higher-elevation regions being more prone to drought. In Bangladesh, elevation is categorized into five classes: 0–32 m, 32–110 m, 110–250 m, 250–460 m, and 460–1052 m (see Fig. 5 (c)). The Chittagong region, characterized by its higher altitude, is particularly susceptible to drought due to its elevation. Lastly, the likelihood of drought decreases as flow accumulation increases, as depicted in Fig. 5 (d). Flow accumulation is classified into five zones: 0–1,190,196, 1,190,196–5,518,184, 5,518,184–11,685,568, 11,685,568–17,744,751, and 17,744,751–27,590,924 (Table 2). Therefore, areas with higher flow accumulation are less prone to drought incidents. Groundwater levels also play a role in drought susceptibility. In Bangladesh, the groundwater level varies from 0.48 m to 8.5 m and is divided into five zones: 0.48–5.1 m, 5.1–8.5 m, 8.5-15 mm, 15-33 mm, and 33-67 m (Table 2). The vicinity of Dhaka and Rajshahi generally exhibits higher groundwater levels, whereas areas such as Sylhet, the hill tracks of Chittagong, and the coastal region tend to have lower groundwater levels (as illustrated in (Fig. 5 (e)). These various geographical factors, such as slope, drainage density, elevation, groundwater level, and flow accumulation, all contribute to the understanding of drought vulnerability in different regions of Bangladesh.
Spatial distribution hydrological drought vulnerability factors: (a) Slope; (b) Drainage Density; (c) Elevation; (d) Flow Accumulation; (e) Groundwater Level; prepared by the authors using ArcGIS software version 10.5, (https://www.esri.com/en-us/arcgis/products).
Spatial distribution socio-economic drought vulnerability factors
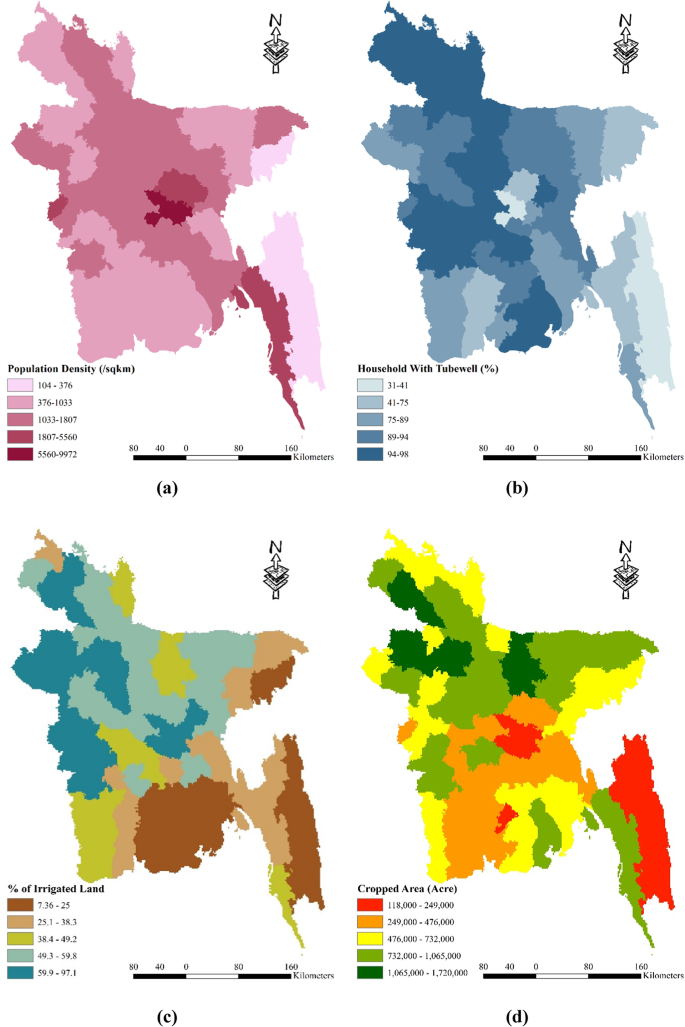
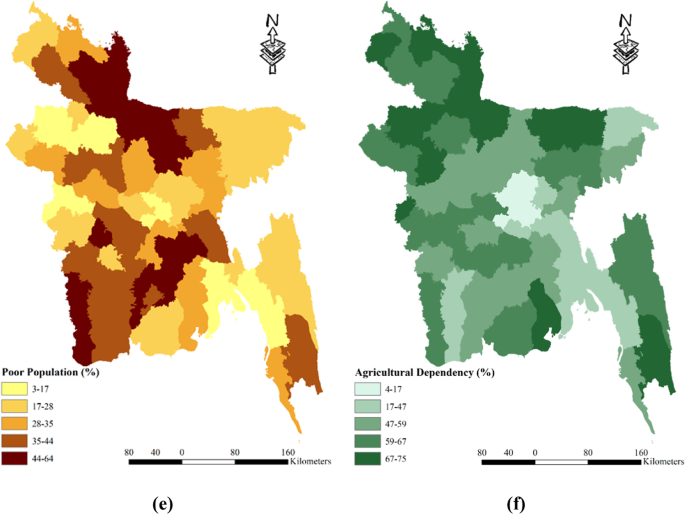
Bangladesh, the eighth-most populous country on Earth, faces various challenges due to its high population density. With a density ranging from 104 to 9972 people per square kilometer, the demand for water resources is significantly increased. The city of Dhaka stands as the most populous area, accommodating an astonishing 9971.37 inhabitants per square kilometer. In terms of population density, there are five categorized zones, namely 104–376, 374–1033, 1033–1807, 1807–5560, and 5560–9972. Among these, the districts of Dhaka and Narayanganj face the greatest risk due to their high population density. On the other hand, Rangamati, Bandarban, Khagrachhari, and Maulvibazar are classified as low-risk areas (see Fig. 6 (a)). Furthermore, the likelihood of drought occurrences is inversely related to the percentage of households equipped with tube wells. The percentage of households with tube wells in Bangladesh ranges from 31 to 98% and is divided into five zones: 31–41%, 41–75%, 75–89%, 89–94%, and 94–98% (Table 2). The districts of Dhaka and Bandarban are particularly vulnerable, as they have fewer than 40% of households with tube wells. Conversely, 18 districts are considered less prone to drought since over 95% of households have access to tube wells (refer to Fig. 6 (b)). It is worth noting that the impact of drought hazards tends to be more severe on impoverished communities. The irrigation land of Bangladesh is classified into five classes as well Fig. 6 (c). The cropped area of Bangladesh is classified into five classes as well Fig. 6 (d). The poor population in Bangladesh is classified into five categories: 3–17%, 17–28%, 28–35%, 35–44%, and 44–64%. Six districts, namely Kurigram, Barisal, Shariatpur, Jamalpur, Chandpur, and Mymensingh, have over 50% of their population living in poverty, making them more susceptible to drought. Conversely, three districts, namely Kushtia, Noakhali, and Chittagong, have less than 15% of their population living in poverty, resulting in lower vulnerability to drought (see Fig. 6 (e)). Additionally, the likelihood of drought occurrences decreases with a higher percentage of the population engaged in agriculture. The study area in Bangladesh exhibits a range of 4 to 75% agriculture-dependent individuals, classified into five zones: 4–27%, 27–47%, 47–59%, 59–67%, and 67–75%. Four districts, namely Dhaka, Narayanganj, Gazipur, and Chittagong, have less than 20% of their population reliant on agriculture, rendering them more vulnerable to drought. Conversely, nine districts with a population consisting of over 70% agriculture-dependent individuals are considered the least vulnerable to drought (see Fig. 6 (f)). A low Agriculture Dependency % is an important element in socioeconomic drought susceptibility because of its complex relationships with economic diversification, income inequality, food security, resource allocation, and cultural dynamics within a community. When a smaller segment relies on agriculture, economic risks emerge because alternative sectors may also be prone to drought. This can result in income inequities, affecting socioeconomic equity, and local agricultural output, especially in low-dependency areas. Moreover, lesser population engaged in agriculture will also mean that the demand of water for irrigation is also lesser, which make those areas less vulnerable to drought. Also, governments may devote fewer resources to regions with low agricultural dependency, ignoring unique concerns, and movements away from traditional farming practices associated with low dependency can have an impact on social fabric and cultural identity87.
Spatial distribution socio economic drought vulnerability factors: (a) Population Density; (b) Household with Tubewell; (c) % of Irrigated Land; (d) Cropped Area (e) Poor Population (f) Agricultural Dependency (%); prepared by the authors using ArcGIS software version 10.5, (https://www.esri.com/en-us/arcgis/products).
In summary, Bangladesh’s population density and its distribution across different districts play a crucial role in determining their vulnerability to drought hazards. The presence of tube wells, poverty levels, and reliance on agriculture further contribute to the susceptibility of specific districts to drought. Understanding these dynamics is essential for implementing targeted measures and interventions to mitigate the impact of drought and safeguard the well-being of the affected communities.
Weight of sub-factors, factors and individual drought maps
In this modeling study, 24 indicators across four categories—socio-economic, meteorological, hydrological, and agricultural—were evaluated to assess drought vulnerability (Table 2). The weights of these indicators were derived from literature, with specific emphasis on the pairwise comparison matrices provided in the tables.
For meteorological drought, indicators such as rainfall and land surface temperature were highlighted with eigenvalues of 0.44 and 0.341, respectively, indicating their significant role in drought assessment (Table 3). Specific humidity and evapotranspiration were assigned lower eigenvalues of 0.143 and 0.076, respectively, reflecting their lesser but still important impact. The meteorological category exhibited a λmax of 4.21 and a consistency ratio (CR) of 7.7%. In the agricultural drought category, diverse indicators such as curvature, land cover, and soil type, among others, were examined. Notably, crop intensity and most used irrigation methods received higher eigenvalues of 0.237 and 0.187, respectively, underscoring their critical importance (Table 4). This category’s λmax and CR were calculated as 9.674 and 5.8%, respectively. Hydrological drought analysis revealed that drainage density had the highest eigenvalue of 0.45, demonstrating its pivotal role, while digital elevation models (DEM) had the lowest eigenvalue of 0.077 (Table 5). This category’s λmax and CR stood at 4.08 and 3.2%, respectively. Socio-economic drought factors such as population density and irrigated land area were assessed, with population density achieving the highest relative importance of 0.311, contrasting with households with tubewell, which had a lower relative importance of 0.172 (Table 6). The socio-economic category had a λmax of 6.09 and a CR of 1.5% (Table 7).
Meteorological drought map
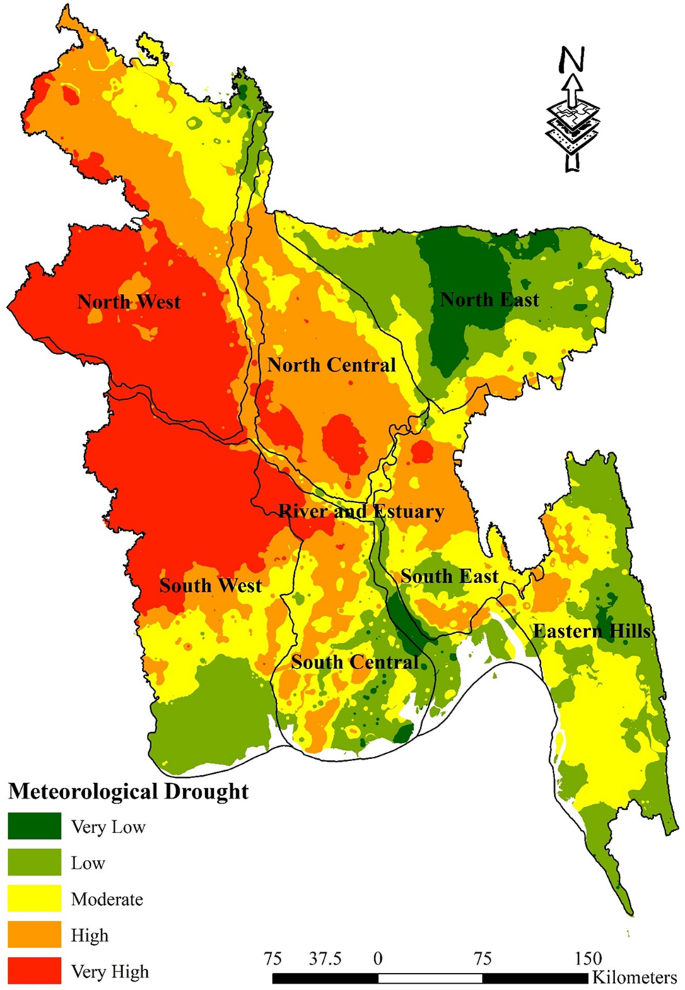
Table 8 shows the percentage of metrological drought vulnerable zones. There is a notable prevalence of moderate vulnerability (48.03%) in the Eastern Hills region, but no locations are categorized as having very high vulnerability (0.00%). Conversely, the North Central region experiences a significant impact from high vulnerability (66.32%), whereas low vulnerability is present to a small extent (2.80%). The region of the North East exhibits a notable proportion of low vulnerability (46.67%) and lacks any instances of very high risk. The North West region exhibits a notably high susceptibility rate of 48.74%, whereas the prevalence of very low vulnerability is almost insignificant at 0.26%. The River and Estuary region exhibits a predominantly low vulnerability rate of 32.24%, whereas instances of very high vulnerability are rather few, accounting for only 11.91%. South Central exhibits a moderate level of susceptibility, accounting for 33.55% of the total, while a lower level of very high vulnerability is observed at 9.77%. The South East region experiences a significant level of susceptibility, accounting for 43.51% of the total, while the lowest level of vulnerability is observed at 0.75%. The South West region has a notably elevated level of vulnerability, with a rate of 49.13%, while no locations are classified as having extremely low or low susceptibility, with a rate of 0.00%. This analysis highlights the diverse vulnerability of Bangladesh’s hydrological regions to meteorological drought, emphasizing particular areas of concern and potential resilience (Fig. 7).
Meteorological Drought Map; prepared by the authors using ArcGIS software version 10.5, (https://www.esri.com/en-us/arcgis/products).
Agricultural drought map
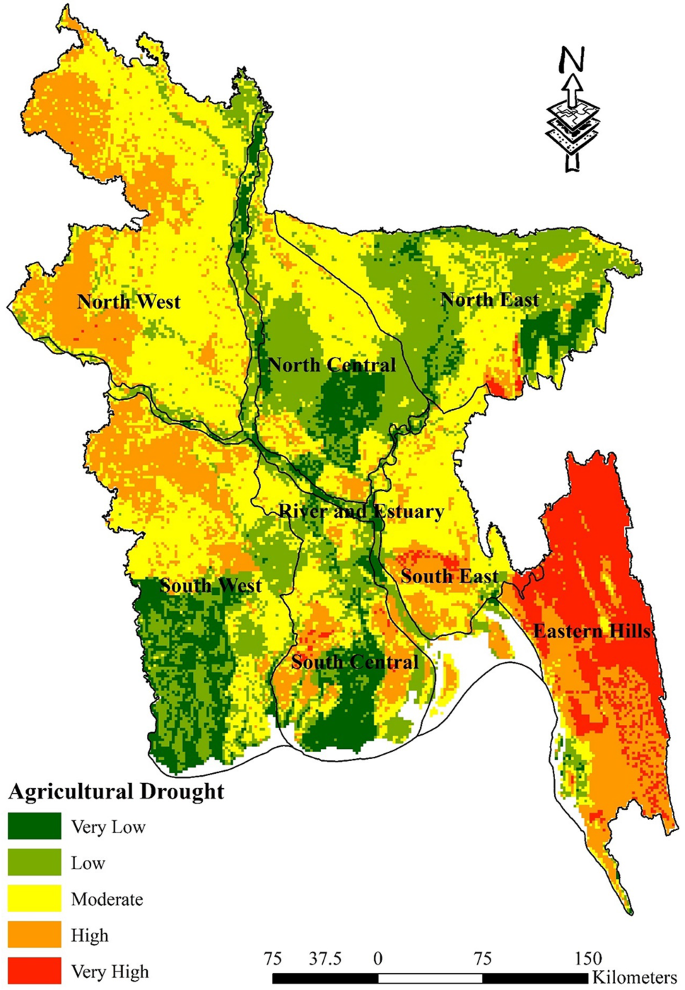
Table 9 displays the proportion of agricultural areas that are susceptible to drought. The Eastern Hills region experiences the highest level of risk, accounting for 54.39% of the total, while the lowest level of vulnerability, at a mere 0.44%, is observed. It is worth noting that the North West region demonstrates the highest proportion of moderate vulnerability among all regions, with a rate of 60.74%. This stands in contrast to the relatively low vulnerability rate of 0.08% observed in other regions. By contrast, the South East region distinguishes itself by having 63.02% of its land area classified as moderate vulnerability, which is the most among all categories. This is in contrast to the very low vulnerability rate of 0.69%. Although the South West does not have any places classified as highly vulnerable, a significant proportion of its territory, specifically 33.37%, falls into the intermediate category. In contrast, the North Central region, which does not have any places with a high level of vulnerability, exhibits its most notable vulnerability in the low category, accounting for 39.52%. The presence of varying levels of vulnerability highlights the urgent requirement for agricultural drought mitigation strategies that are tailored to specific regions. This is particularly crucial in areas such as the North West and South East, where moderate vulnerability is prevalent. This indicates a pressing necessity for targeted interventions aimed at enhancing resilience against the impacts of agricultural drought (Fig. 8).
Agricultural Drought Map; prepared by the authors using ArcGIS software version 10.5, (https://www.esri.com/en-us/arcgis/products).
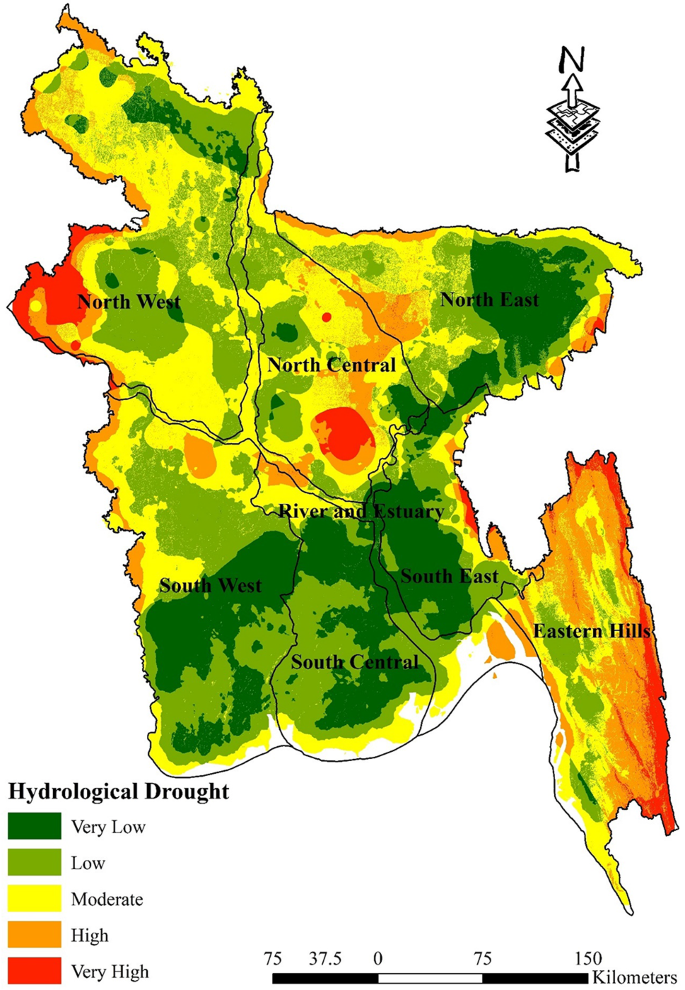
Hydrological drought map
Table 9 displays the proportion of areas that are susceptible to hydrological drought. In the Eastern Hills, there is a significant vulnerability rate of 42.35%. However, the entrance point for very low vulnerability is very low at 0.38%, while moderate vulnerability is found at 29.58%. The North Central region has a combination of susceptibility, with moderate vulnerability accounting for 41.85% and very low vulnerability accounting for 4.74%. The distribution of drought risk in the North East and North West areas exhibits a balanced pattern, with the low and moderate categories reaching their respective peaks. This suggests the presence of a nuanced drought risk. The intermediate group has a dominant presence in the River and Estuary, accounting for 39.13% of the total, while the extremely high category has a negligible presence of 2.28%. The terrain of South Central is characterised by a notable low vulnerability rate of 44.07%, while the extremely high vulnerability rate is negligible at 0.00%. Additionally, there is a moderate vulnerability rate of 15.09%. The South East region exhibits a very low vulnerability rate of 49.02%, indicating a lower chance of drought. In contrast, the South West region largely has a low vulnerability rate of 41.06%, with extremely high vulnerability being nearly nonexistent at 0.01%. This indicates a range of risk levels, with intermediate vulnerability observed at 22.74%. The depiction highlights the intricate dynamics of hydrological drought susceptibility throughout Bangladesh, emphasising the necessity for customised measures to mitigate risks that encompass both the most severe risks and the intermediate vulnerabilities that impact a substantial percentage of the terrain. Understanding these vulnerability patterns can inform targeted mitigation and adaptation strategies to address the potential impacts of drought (Fig. 9; Table 10).
Hydrological Drought Map; prepared by the authors using ArcGIS software version 10.5, (https://www.esri.com/en-us/arcgis/products).
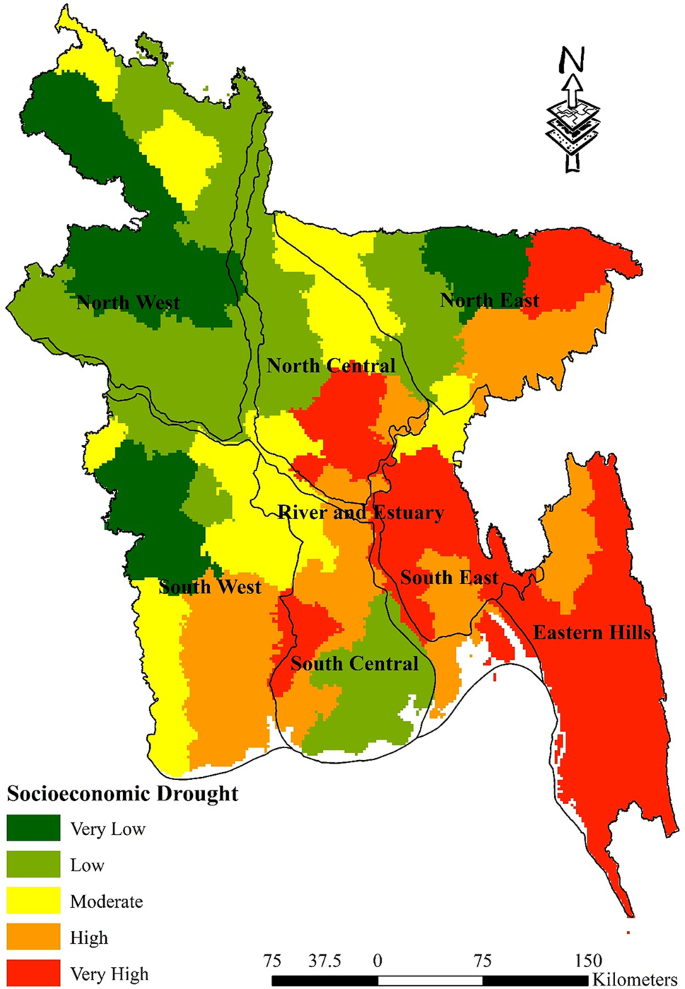
Socio-economic drought
Table 11 displays the proportion of socioeconomic regions that are susceptible to drought. In the Eastern Hills region, a significant proportion of 85.45% of the land area is classified as “Very High” vulnerability, hence emphasizing the pronounced hazards encountered by this particular area. In contrast, the North Central region has a notable proportion of 38.51% of its land area classified as “Low” vulnerability. This suggests that the region is comparatively less impacted by socioeconomic drought factors. However, it is important to acknowledge that the region still possesses vulnerabilities that warrant attention. The North East region, which has a significant 23.66% of its population classified as “Low” susceptibility, indicates a well-balanced and prudent strategy for managing drought risk. Conversely, the North West region does not exhibit any areas categorized as “High” susceptibility, thus focusing on its other vulnerabilities. The River and Estuary region has a notable prevalence of vulnerability, with 40.72% falling under the “Low” category. This is contrasted with a concerning 20.90% falling under the “Very High” category, indicating the intricate relationship between water availability and socioeconomic stability. The sensitivity of the South-Central region is notably high, with a percentage of 33.44%. This indicates the presence of distinct socioeconomic issues that contribute to the increased susceptibility to drought. In contrast, the South East region exhibits a notable prevalence of 65.95% categorized as “Very High” vulnerability, highlighting significant obstacles that necessitate prompt and focused actions. Furthermore, the South West region exhibits a significant 31.80% of its population falling into the “High” vulnerability group, while only a comparatively small 1.97% falls into the “Very High” category. This indicates a combination of vulnerabilities that require sophisticated strategies for mitigating drought and providing socioeconomic assistance. This comprehensive analysis of socioeconomic drought vulnerability in Bangladesh underscores the imperative for region-specific approaches that effectively tackle the distinct problems and vulnerabilities of each locality. It sheds light on places characterized by significant risk as well as those that hold promise for fostering resilience (Fig. 10).
Socio-economic Drought Map; prepared by the authors using ArcGIS software version 10.5, (https://www.esri.com/en-us/arcgis/products).
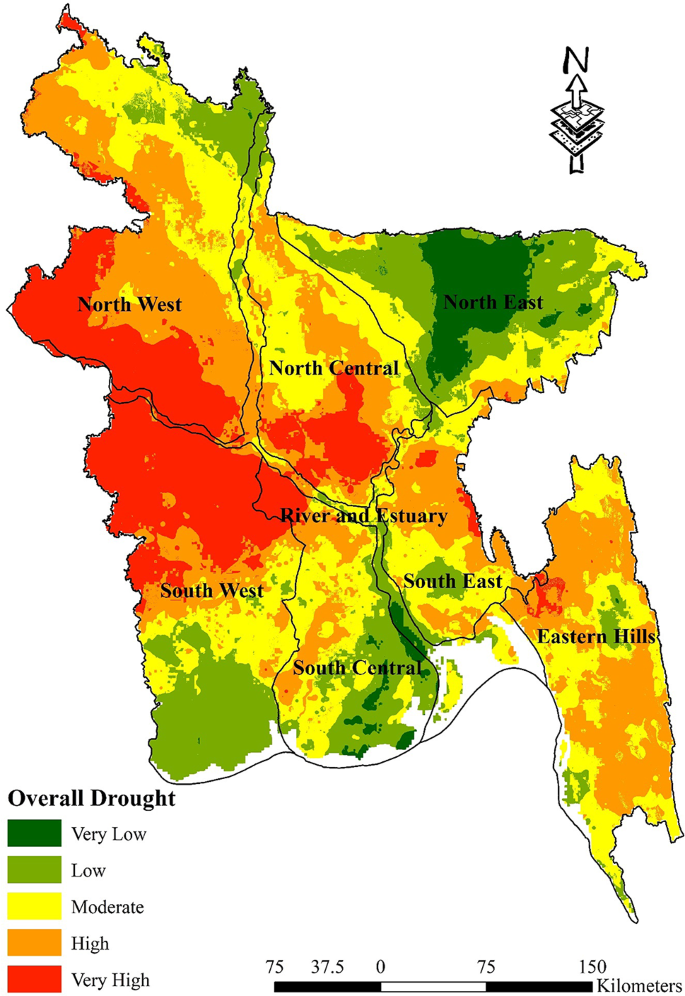
Overall drought vulnerability map
Table 12 displays the proportion of regions that are susceptible to drought. The Eastern Hills exhibit a significantly high vulnerability rate of 56.85%, and it has an extremely low vulnerability rate of 0.03%. The North Central region has a substantial percentage of its land area vulnerable to high levels (35.85%) and a conspicuous lack of susceptibility at very low levels. In the North East, a significant proportion (41.68%) is classified as low vulnerability, indicating a distinct risk profile in contrast to the extremely low vulnerability, which is nearly insignificant. The North West region exhibits a notable susceptibility rate of 40.39%, underscoring its significance as a crucial location for the implementation of drought management strategies. The region encompassing the River and Estuary exhibits a modest vulnerability percentage, specifically 38.44%, which suggests a well-balanced distribution across the spectrum of susceptibility. The South Central and South East regions have significant vulnerabilities, with 18.99% and 39.60% respectively, highlighting the varied effects of drought throughout the nation. The South West region exhibits a notable level of sensitivity (41.06%), indicating a pronounced susceptibility to drought hazards. This detailed analysis highlights the diverse susceptibility to drought across Bangladesh, underscoring the necessity of implementing region-specific approaches to tackle the difficulties presented by various types of droughts (Fig. 11).
Overall Drought Vulnerability Map; prepared by the authors using ArcGIS software version 10.5, (https://www.esri.com/en-us/arcgis/products).
Validation
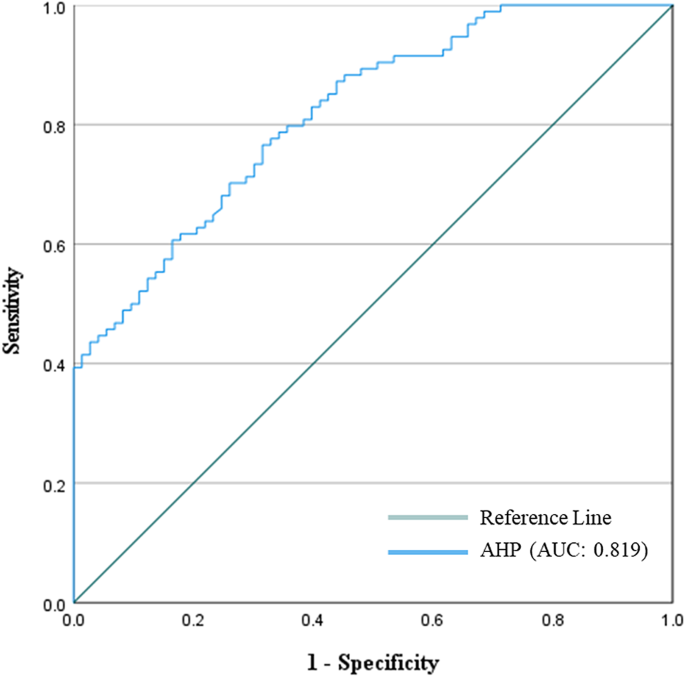
In order to assess the performance of predictive models, it is crucial to conduct testing or validation procedures. In this particular study, we adopted the ROC curve method for model validation, specifically focusing on the AUC. This method serves as a fundamental component of probability-based mapping and plays a vital role in the success of most statistical or probabilistic models. The ROC curve, widely recognized and preferred in the field, has been employed in numerous studies, including reference47. The resulting AUC value, which stands at 0.819, demonstrates an acceptable level of performance (as depicted in Fig. 12). This metric serves as a reliable indicator of the model’s predictive ability, suggesting that the model’s predictions align reasonably well with the observed data.

